Example usage
How we use deepTools for ChIP-seq analyses
To get a feeling for what deepTools can do, we’d like to give you a brief glimpse into how we typically use deepTools for ChIP-seq analyses. For more detailed exampes and descriptions of the tools, simply follow the respective links.
Note
While some tools, such as plotFingerprint, specifically address ChIP-seq-issues, the majority of tools is widely applicable to deep-sequencing data, including RNA-seq.
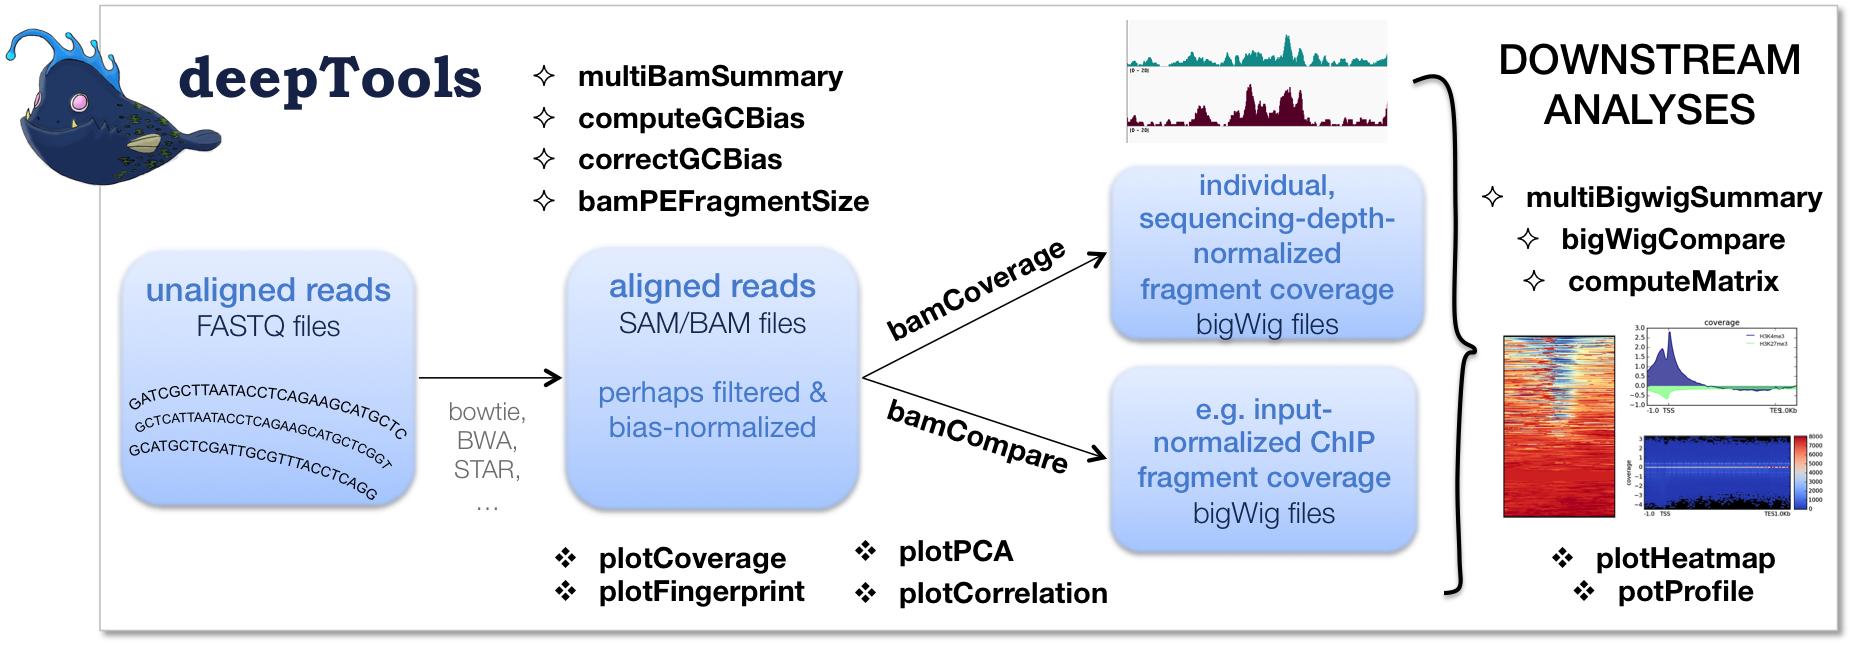
As shown in the flow chart above, our work usually begins with one or more FASTQ file(s) of deeply-sequenced samples. After preliminary quality control using FASTQC, we align the reads to the reference genome, e.g., using bowtie2. The standard output of bowtie2 (and other mapping tools) is in the form of sorted and indexed BAM files that provide the common input and starting point for all subsequent deepTools analyses. We then use deepTools to assess the quality of the aligned reads:
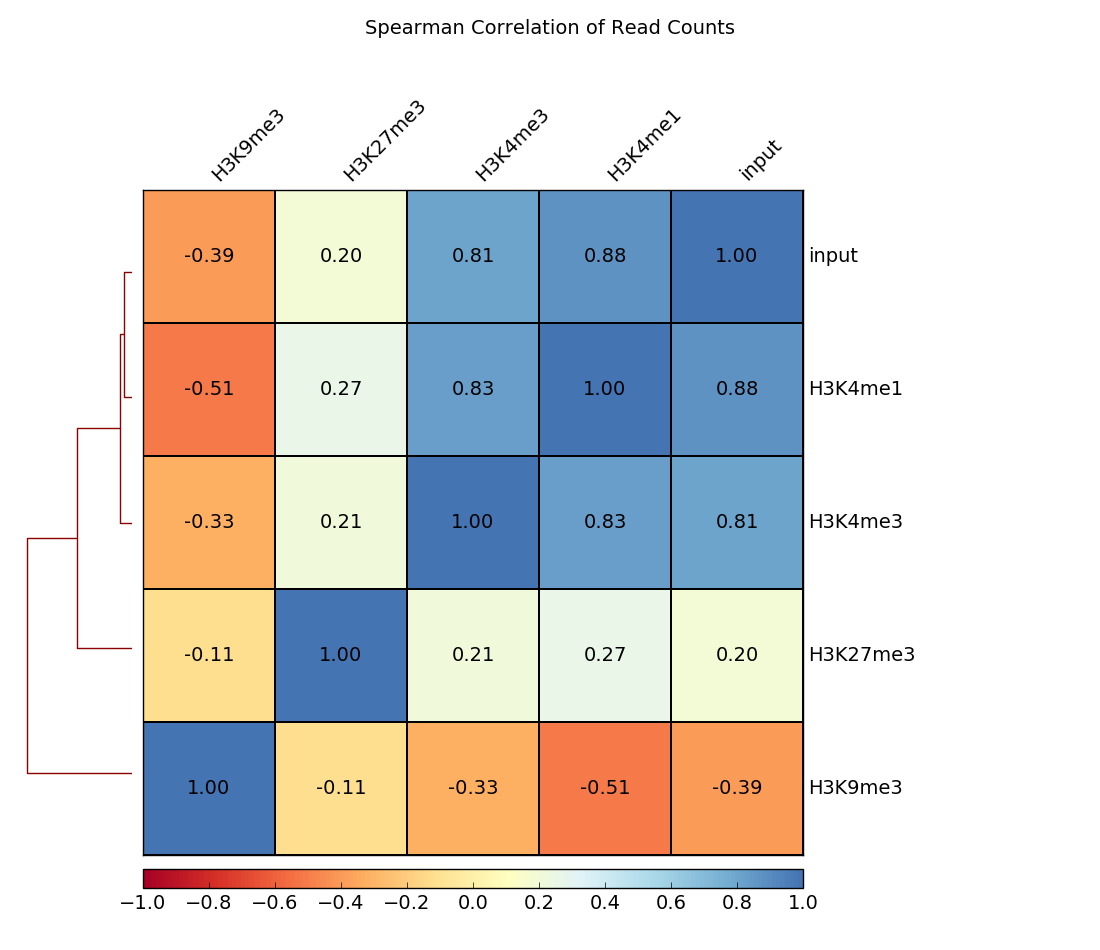
Correlation between BAM files (multiBamSummary and plotCorrelation). Together, these two modules perform a very basic test to see whether the sequenced and aligned reads meet your expectations. We use this check to assess reproducibility - either between replicates and/or between different experiments that might have used the same antibody or the same cell type, etc. For instance, replicates should correlate better than differently treated samples.
Tip
You can also assess the correlation of bigWig files using multiBigwigSummary.
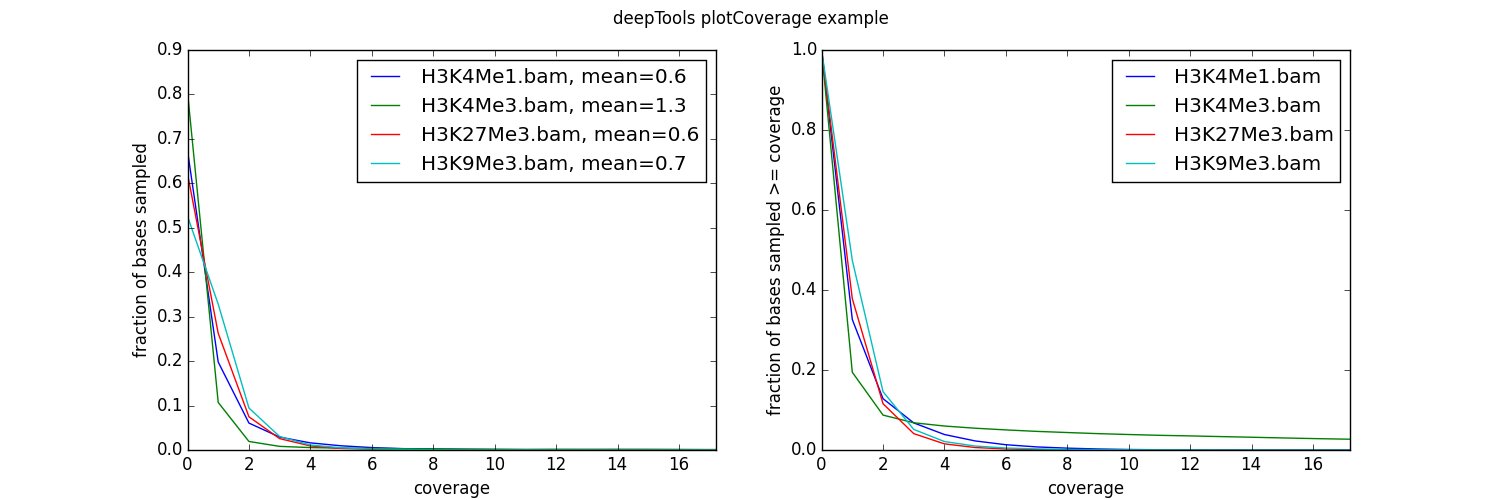
- Coverage check (plotCoverage). To see how many bp in the genome are actually covered by (a good number) of sequencing reads, we use plotCoverage which generates two diagnostic plots that help us decide whether we need to sequence deeper or not. The option
--ignoreDuplicatesis particularly useful here!
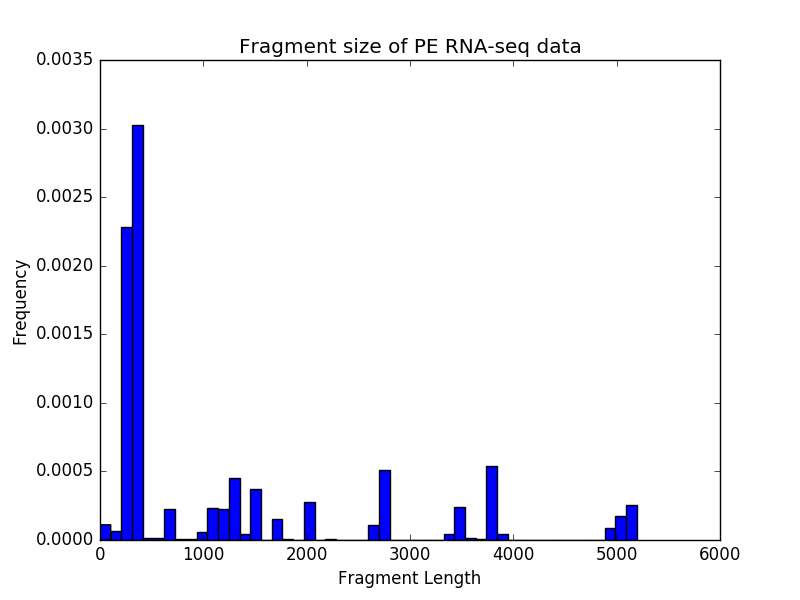
For paired-end samples, we often additionally check whether the fragment sizes are more or less what we would expected based on the library preparation. The module bamPEFragmentSize can be used for that.
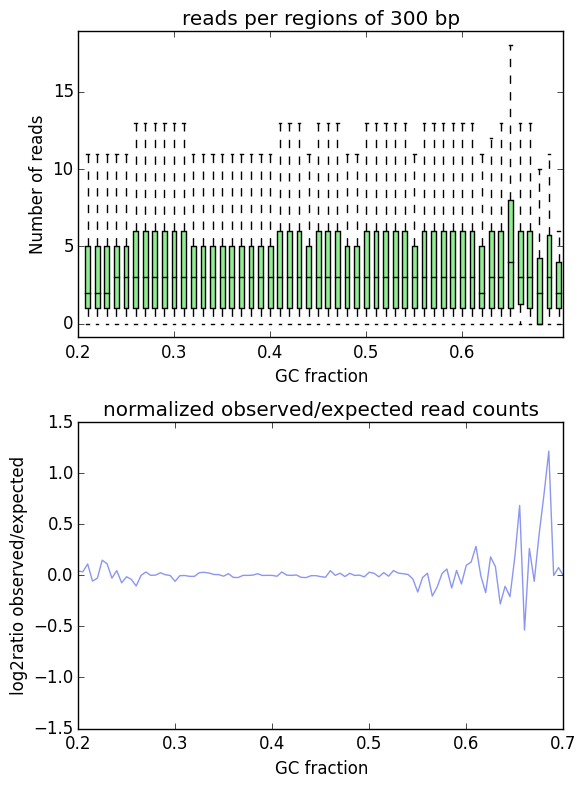
- GC-bias check (computeGCBias). Many sequencing protocols require several rounds of PCR-based DNA amplification, which often introduces notable bias, due to many DNA polymerases preferentially amplifying GC-rich templates. Depending on the sample (preparation), the GC-bias can vary significantly and we routinely check its extent. When we need to compare files with different GC biases, we use the correctGCBias module. See the paper by Benjamini and Speed for many insights into this problem.
- Assessing the ChIP strength. We do this quality control step to get a feeling for the signal-to-noise ratio in samples from ChIP-seq experiments. It is based on the insights published by Diaz et al.

Once we’re satisfied with the basic quality checks, we normally convert the large BAM files into a leaner data format, typically bigWig. bigWig files have several advantages over BAM files, mainly stemming from their significantly decreased size:
- useful for data sharing and storage
- intuitive visualization in Genome Browsers (e.g. IGV)
- more efficient downstream analyses are possible
The deepTools modules bamCompare and bamCoverage not only allow for simple conversion of BAM to bigWig (or bedGraph for that matter), but also for normalization, such that different samples can be compared despite differences in their sequencing depth.
Finally, once all the converted files have passed our visual inspections (e.g., using the Integrative Genomics Viewer), the fun of downstream analysis with computeMatrix, plotHeatmap and plotProfile can begin!
| deepTools Galaxy. | code @ github. |