computeMatrix
Details
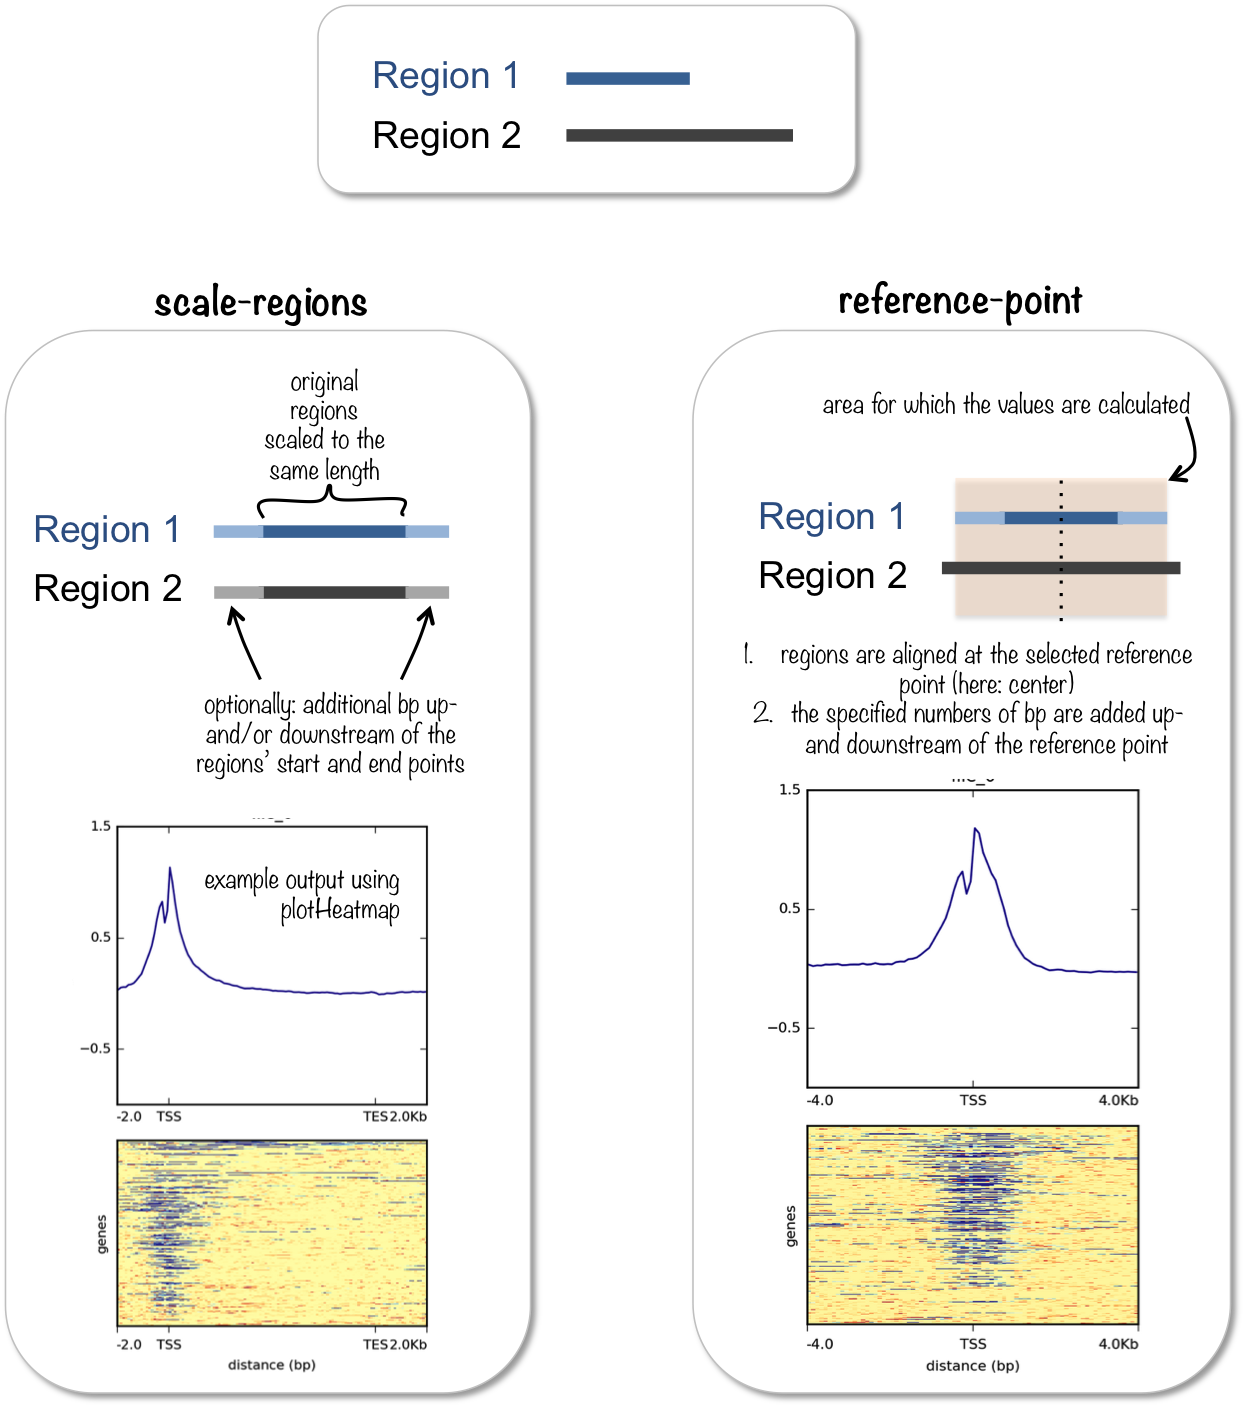
computeMatrix has two main modes of use:
- for computing the signal distribution relative to a point (
reference-point), e.g., the beginning or end of each genomic region - for computing the signal over a set of regions (
scale-regions) where all regions are scaled to the same size
computeMatrix is tightly connected to plotHeatmap and plotProfile: it takes the values of all the signal files and all genomic regions that you would like to plot and computes the corresponding data matrix.
See plotHeatmap and plotProfile for example plots.
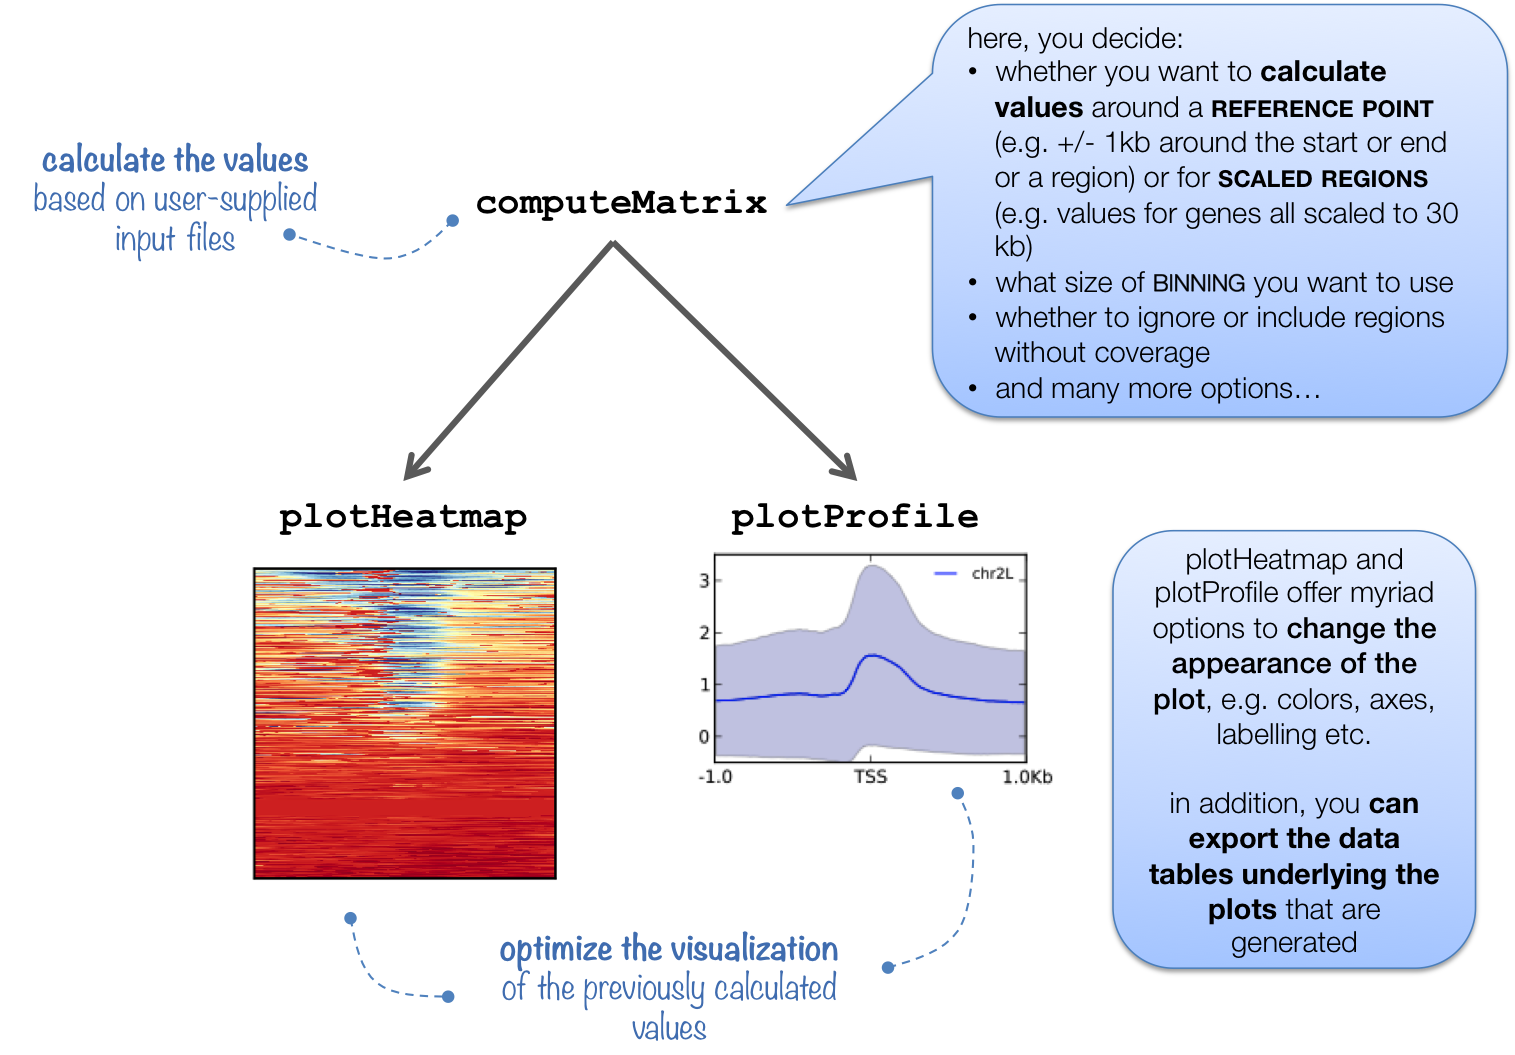
In addition to generating the intermediate, gzipped file for plotHeatmap and plotProfile, computeMatrix can also be used to simply output the values underlying the heatmap or to filter and sort BED files using, for example, the --skipZeros and the --sortUsing parameters.
The following tables summarizes the kinds of optional outputs that are available with the three tools.
| optional output type | command | computeMatrix | plotHeatmap | plotProfile |
| values underlying the heatmap | --outFileNameMatrix |
yes | yes | no |
| values underlying the profile | --outFileNameData |
no | yes | yes |
| sorted and/or filtered regions | --outFileSortedRegions |
yes | yes | yes |
Tip
computeMatrix can use multiple threads (-p option), which significantly decreases the time for calculating the values.
Attention
As of version 3.0, computeMatrix produces output with labels present for each sample. Matrices produced with that or later versions can not be used with older versions of plotHeatmap or any other deepTools program.
Examples
The following examples should give you an idea of some of the most often used settings for computeMatrix. As you can see, computeMatrix offers myriad tweaks and may turn out to be more useful to you than “just” to calculate heatmap matrices.
Example 1: single input files (reference-point mode)
Here, we start with a single bigWig and a single BED file, i.e., computeMatrix will:
- take the beginning of the regions specified in the BED file
- add the values indicated with
--beforeRegionStartLength(-b) and--afterRegionStartLength(-a) - split the resulting region up into 50 bp bins (can be changed via (
--binSize) - calculate the mean score based on the scores given in the bigWig file (the kind of score can be changed via
--averageTypeBins) - write out the values where each row corresponds to one region in the BED file (note that you can, for example, skip regions with zero coverage; sorting is also possible)
$ computeMatrix reference-point \ # choose the mode
       --referencePoint TSS \ # alternatives: TES, center
       -b 3000 -a 10000 \ # define the region you are interested in
       -R testFiles/genes.bed \
       -S testFiles/log2ratio_H3K4Me3_chr19.bw  \
       --skipZeros \
       -o matrix1_H3K4me3_l2r_TSS.gz \ # to be used with plotHeatmap and plotProfile
       --outFileSortedRegions regions1_H3K4me3_l2r_genes.bed
Let’s have a closer look at the regions’ output:
$ wc -l testFiles/genes.bed # original file
   18257 testFiles/genes.bed
$ wc -l regions1_H3K4me3_l2r_genes.bed # file generated by computeMatrix
   12423 regions1_H3K4me3_l2r_genes.bed
As you can see, the number of regions is drastically reduced. The remaining genes happen to be the ones on chromosome 19 for which there was at least one overlapping read. This makes sense since the bigWig file used above only contained reads for chromosome 19.
# the original file contained genes for chr.19 and chr.X
$ cut -f 1 testFiles/genes.bed | sort | uniq -c
    12439 19
    5818 X

# the regions used for the computation of the matrix for the heatmap are all located on chr.19 due to the --skipZeros setting (see above)
$ cut -f 1 regions1_H3K4me3_l2r_genes.bed | sort | uniq -c
    1 #genes
    12422 19
Example 2: multiple input files (scale-regions mode)
$ deepTools2.0/bin/computeMatrix scale-regions \
  -R genes_chr19_firstHalf.bed genes_chr19_secondHalf.bed \ # separate multiple files with spaces
  -S testFiles/log2ratio_*.bw  \ or use the wild card approach
  -b 3000 -a 3000 \
  --regionBodyLength 5000 \
  --skipZeros -o matrix2_multipleBW_l2r_twoGroups_scaled.gz \
  --outFileNameMatrix matrix2_multipleBW_l2r_twoGroups_scaled.tab \
  --outFileSortedRegions regions2_multipleBW_l2r_twoGroups_genes.bed
Note that the reported regions will have the same coordinates as the ones in the originally supplied file, not the region that was used for the heatmap matrix.
The groups of regions supplied by two individual files will be merged into one:
$ head -n 2 regions2_multipleBW_l2r_twoGroups_genes.bed
19  60104   70951   ENST00000592209 0.0     -       genes_chr19_firstHalf
19  60950   70966   ENST00000606728 0.0     -       genes_chr19_firstHalf

$ tail -n 3 regions2_multipleBW_l2r_twoGroups_genes.bed
19  59108549        59110722        ENST00000596427 0.0     -       genes_chr19_secondHalf
19  59110333        59110802        ENST00000464061 0.0     +       genes_chr19_secondHalf
#genes_chr19_secondHalf
Tip
More examples can be found in our Gallery.
| deepTools Galaxy. | code @ github. |